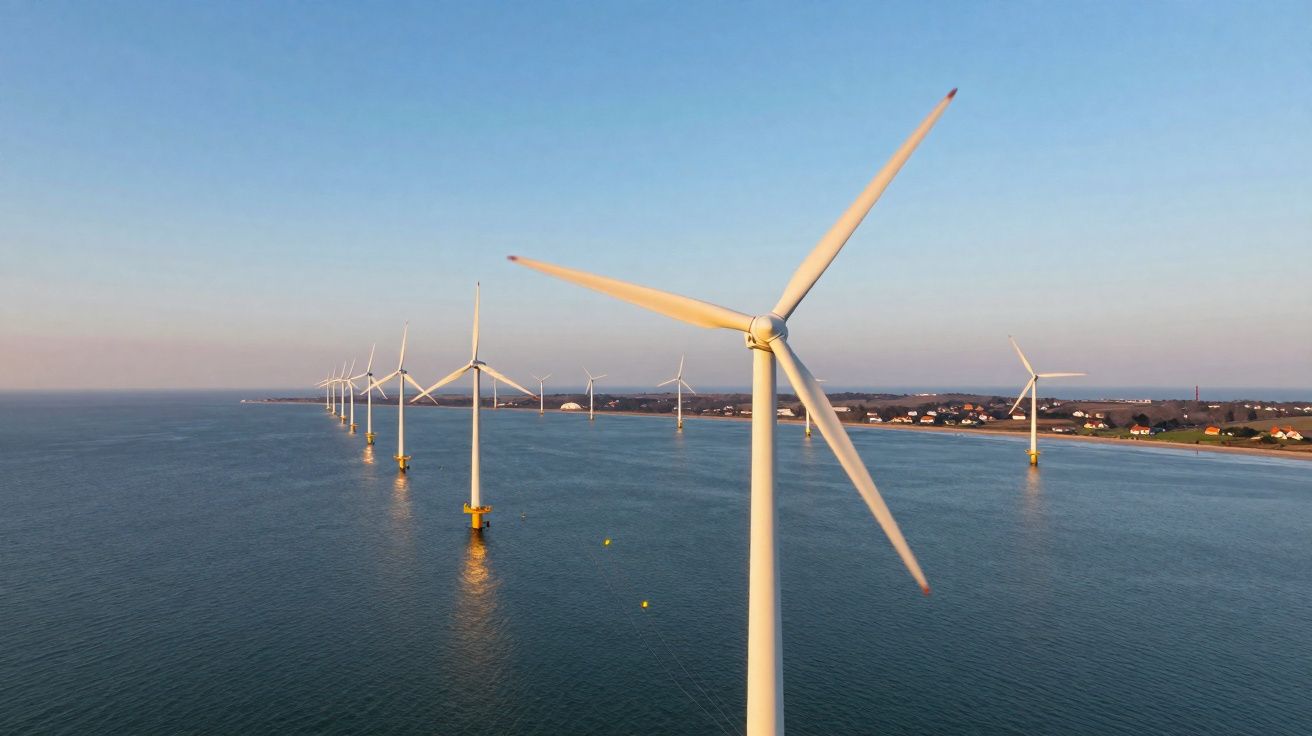
On a raw, gusty evening in mid-November, Great Britain’s offshore wind fleet slipped past a landmark that would have been easy to miss from the kitchen window. As households turned up the heating and put the kettle on, turbines out in the North Sea were producing enough electricity to briefly shift the balance of the entire power system.
Record night for offshore wind and onshore wind: 22.7 gigawatts sets a new benchmark
On 11 November 2025, powerful weather systems over northern England and the Scottish coastline pushed thousands of turbines-both offshore and onshore-towards peak output. Figures from the National Energy System Operator (Neso) show wind generation hit a record 22.7 gigawatts, the highest ever recorded in Great Britain.
At the high point, wind power on its own was capable of supplying the equivalent of roughly 22 million homes. In other words, at a time of strong demand-when the grid has historically leaned on natural gas-the wind was, for a few decisive hours, covering almost the whole country’s household needs.
Wind supplied 55.7% of Britain’s electricity on 11 November, with more than 22.7 GW coming from turbines across land and sea.
Neso’s breakdown shows that 43.6% of generation that evening came from wind farms connected to the national transmission system. Another 12.1% was delivered by embedded wind generation: smaller schemes and local networks feeding electricity into regional systems without travelling across high‑voltage transmission lines.
Together, these two streams took wind’s overall share to 55.7%-a psychologically significant mark for a grid long defined first by coal and, more recently, by gas.
A changing energy mix that goes beyond one windy evening
Even when the weather is favourable, a modern electricity system does not run on a single technology. While wind carried the bulk of generation on 11 November, other sources still played essential roles in keeping the grid stable, flexible and secure.
Britain’s electricity mix on 11 November (Neso snapshot)
Neso’s numbers that evening read less like a sudden revolution and more like a clear snapshot of transition.
| Energy source | Share of generation | Homes supplied (equivalent) |
|---|---|---|
| Wind (national grid) | 43.6% | 17.2 million |
| Wind (local networks) | 12.1% | 4.8 million |
| Natural gas | 12.5% | 4.9 million |
| Interconnectors (imports) | 11.3% | 4.4 million |
| Nuclear | 8% | 3.1 million |
| Biomass | 8% | 3.1 million |
| Hydropower | 1.4% | 560,000 |
| Storage | 1.1% | 440,000 |
Even on a record wind night, gas still contributed about one eighth of generation-providing controllable power when demand shifts quickly or when wind output changes. Nuclear and biomass delivered steadier, less weather-dependent output, while interconnectors (imports) through subsea links helped balance the difference between what Britain was producing and what it was consuming.
Although storage remained relatively small at 1.1%, it was still meaningful. As batteries and pumped‑storage schemes expand, they increasingly soak up short surges and release power during brief dips-reducing how often fossil‑fuelled stations need to ramp up and down.
The broadening mix of wind, nuclear, biomass, hydro and storage points to a grid that relies less on gas and steadily breaks long-standing fossil‑fuel habits.
From price shocks to stacked turbines: why the 22.7 GW record matters
Less exposure to gas and oil volatility
When wind output is high, wholesale electricity prices often come down because wind farms do not require imported fuel. Their economics are not tied to gas supply contracts, pipeline disruption, or the day‑to‑day swings in oil and LNG markets.
Once turbines are installed and export cables are connected to shore, operating costs are comparatively predictable: maintenance, insurance, financing and grid charges remain, but there is no ongoing fuel bill. Each additional megawatt-hour produced by wind can displace generation that might otherwise have come from gas‑fired stations-directly influencing bills when markets are tight.
This is not a promise of cheap power every day. During calm spells, the system still turns back to gas plants and imports. However, record events like 11 November demonstrate just how far gas demand can fall when wind conditions and system operation align.
Climate, air quality and local industry effects
Every gigawatt-hour generated from wind reduces emissions compared with gas or coal. Offshore wind produces electricity with no direct CO₂ emissions and creates no local particulate pollution or nitrogen oxides at the point of generation. That supports the UK’s ability to stay within its carbon budgets under the Climate Change Act, while gradually improving air quality-particularly in and around industrial areas and urban centres where fossil generation has historically been concentrated.
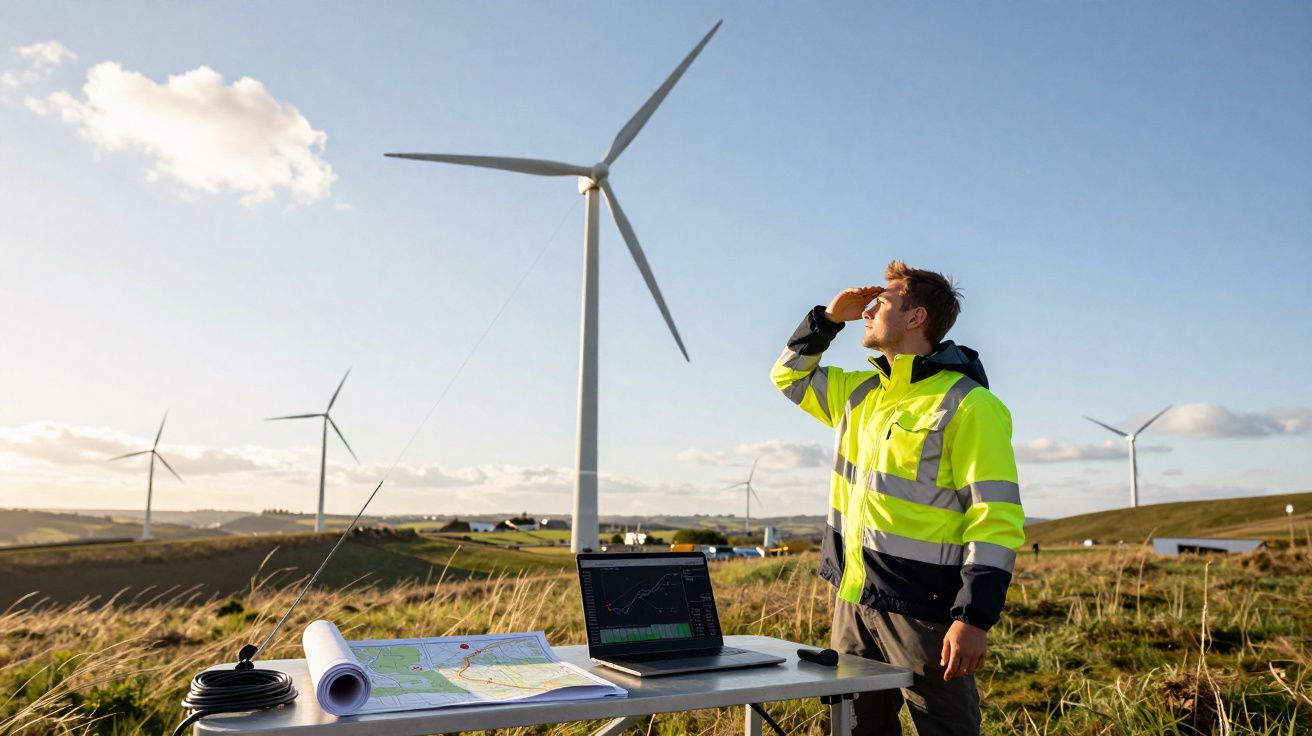
There is also a clear industrial dimension. Ports from Hull to Teesside have increasingly repositioned themselves as offshore wind hubs, handling blades, foundations, converter platforms and subsea cables. The 22.7 GW peak did not merely keep lights on; it reflected sustained investment in supply chains, workforce training and port infrastructure.
Offshore giants and the North Sea build-out: the Dogger Bank era
Dogger Bank and its North Sea peers
A significant share of this momentum comes from the scale of modern offshore developments that have effectively turned parts of the North Sea into a continuous construction and operations zone. Dogger Bank, a shallow sandbank about 130 kilometres off England’s north‑east coast, is set to become the world’s largest offshore wind complex.
Built in three phases-Dogger Bank A, B and C-the development is expected to reach around 3.6 GW of installed capacity once fully completed. That puts it in the same league as major conventional power stations, delivered via hundreds of turbines located far beyond the shoreline.
Dogger Bank is only part of the story. Several of the world’s largest offshore wind farms operate in UK waters, and many were already contributing during the November record.
The world’s largest offshore wind farms today
- Dogger Bank (UK): 3,600 MW planned capacity across three phases, with 277 turbines scheduled between 2023 and 2026.
- Hornsea 2 (UK): 1,386 MW from 165 turbines in the North Sea, fully operational since 2022.
- Hornsea 1 (UK): 1,218 MW, among the earliest mega-scale offshore projects when it began generating in 2020.
- Walney Extension (UK): 659 MW in the Irish Sea, commissioned in 2018.
- Borssele 1 & 2 (Netherlands): 752 MW, a major North Sea development outside UK waters.
These large schemes benefit from economies of scale: bigger turbines capture more energy per foundation, export cables carry higher power flows, and grid operators can manage output through fewer high-capacity connection points rather than many small ones spread across the coast.
Dogger Bank and the Hornsea cluster increasingly operate like backbone infrastructure, shaping how Britain plans and runs its power system into the 2030s.
How close can Britain get to a zero‑carbon grid?
The prospect of fossil‑free hours
Neso’s chief operating officer, Kayte O’Neill, has repeatedly said Britain could run the grid with zero direct CO₂ emissions for several hours at a time-and, in time, for full days. The UK has already experienced extended periods with no coal on the system; extending that progress to gas is the next major milestone.
Reaching longer fossil‑free stretches requires three ingredients: more low‑carbon generation capacity, more flexibility, and smarter demand. The 11 November record mainly showcased capacity, but it also suggested progress on flexibility and demand response.
On the flexibility side, batteries and pumped‑storage can absorb brief surpluses and fill short gaps. Interconnectors to Norway, France, Belgium, the Netherlands and Denmark provide additional options-acting as pressure valves when the region is tight or when wind output is exceptionally high. Meanwhile, demand‑side response schemes pay businesses-and increasingly households-to shift consumption away from peak periods, lowering system stress in exchange for reduced bills.
The intermittency challenge, without the jargon
Wind output cannot be ordered on demand. When generation drops sharply, system operators need backup they can bring on line in minutes-or sometimes seconds. Gas turbines still provide much of that fast response today, although storage, hydropower and flexible demand are steadily taking a larger share of the balancing role.
The headline number-22.7 GW-shows what is technically possible. The tougher question is reliability across less cooperative weather patterns. Can wind sustain very high shares not only on standout nights, but through long, mild winter spells when demand remains elevated and wind speeds fall?
This is where planning and modelling become decisive. Operators rely on detailed weather forecasting, probabilistic simulations and historical performance to decide how much dispatchable capacity must remain available. Offshore wind is generally steadier than onshore wind, yet even offshore fleets can face lulls when high‑pressure systems settle over the North Sea.
Two additional realities behind record wind output: grid constraints and environmental stewardship
High wind output does not always translate into maximum useful electricity. At times, parts of the transmission system become congested, and wind farms may be paid to reduce output-known as curtailment-because the electricity cannot be moved efficiently from where it is generated to where it is needed. Records like 11 November increase the incentive to reinforce network capacity, improve regional balancing, and invest in solutions such as longer-duration storage and better local consumption of surplus power.
There is also the question of how offshore wind growth is managed in practice. Alongside climate benefits, developers and regulators must address impacts on marine habitats, fishing activity and shipping lanes, while ensuring that communities hosting cable landfalls and coastal infrastructure see meaningful local benefits. Careful site design, monitoring and community engagement are part of what will determine how quickly the next phase of offshore wind can be delivered.
What the milestone means for households, investors and policy
For households, the message is encouraging but not instant. One exceptional evening does not automatically lower bills the next morning. Over time, however, every extra gigawatt of low‑cost wind generation can reduce exposure to imported gas price shocks. The record illustrates how sharply gas demand can be cut during crunch periods-the same kind of periods that fuelled recent wholesale price spikes.
For investors, the figures reinforce the UK’s position as one of the world’s most active offshore wind markets. Developments such as Dogger Bank, Hornsea and emerging floating wind projects depend on confidence that the grid can integrate large volumes of variable generation and that policy support remains broadly stable. This November benchmark supports that investment case.
For policymakers, the numbers are a practical test of the government’s 2030 ambition to source roughly 95% of Britain’s electricity from low‑carbon power. Meeting that target depends on wind and solar growth alongside nuclear life extensions, potentially new reactors, more flexible storage and stronger demand‑side measures-while maintaining security of supply and avoiding undue price increases.
Technically, 11 November offers a real-world stress test that can be dissected in detail: frequency behaviour, ramp rates, constraint payments and curtailment, plus how interconnectors and storage responded. For anyone trying to understand the difference between 30%, 50% or 70% wind on a national grid, this record serves as a live case study-showing, in measurable terms, how Britain’s power system behaves when wind takes the lead.


Comments
No comments yet. Be the first to comment!
Leave a Comment